 Map-based Educational Tools for Algorithm Learning (METAL)
led by Dr. James D. Teresco
We have worked to make the interface
to
HDX self-explanatory, but there are
some features a user might not notice. This page is here to point
out those features.
Loading Data
When you first load HDX, you are presented with choices of how to load data:
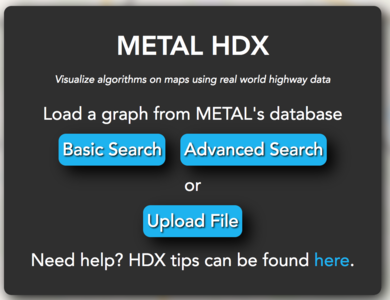
Most users looking to run an algorithm visualization (AV) in HDX will
choose the "Basic Search" or "Advanced Search" to load a graph
directly from METAL's collection. "Basic Search" allows you to start
typing a place name to get suggestions to load in METAL's default
graph format, while "Advanced Search" provides the ability to filter
by various criteria including graph size and format, then choose
from a complete list of matching graphs.
The "Upload" option allows a file to be uploaded from the user's
device, which can be a graph file or one of the other formats
supported by HDX.
A graph file to load from METAL's database can also be specified as
part of the URL in the
load= query string parameter. For
example, to start HDX with the Siena College 25-mile radius graph
loaded, the
URL
https://courses.teresco.org/metal/hdx?load=siena25-area.tmg
can be used.
After a graph is loaded successfully, the next screen
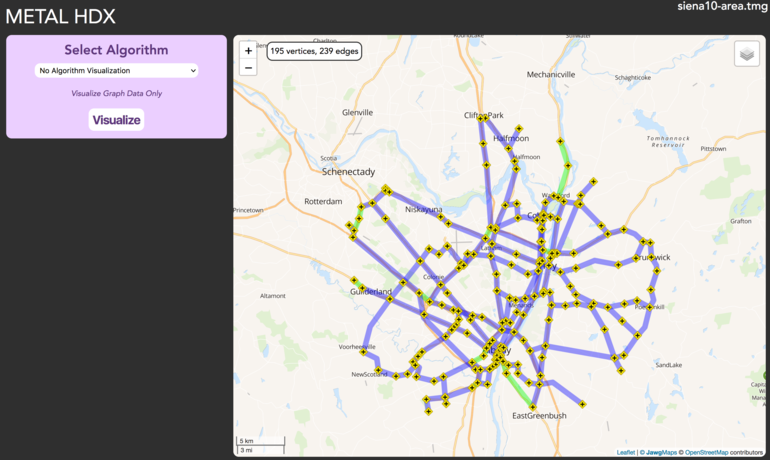
shows the graph data plotted over the map on the right, and a panel
to select an algorithm on the left. At this point, a user can pan
and zoom the map to explore the data. Clicking on vertices
(also called "waypoints" in METAL terminology) and edges (also
called "connections") on the map brings up popup windows with
additional information about them. Note also that the size of
the graph is shown as a map overlay.
A further configuration option is to select the set
of map tiles to use behind METAL's data. The

icon, found in the upper right corner of
the map, brings up a menu with several options. Your choice will be
remembered in a browser cookie.
Selecting an Algorithm
In the "Select Algorithm" panel, most users will choose one of the
options, which brings up a brief description of the algorithm and
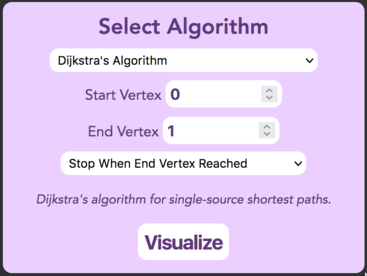
allows any additional parameters to be set. For example, if
"Dijkstra'a Algorithm" is selected, the contents of the "Select
Algorithm" panel will be updated to contain:
And for "Vertex Extremes Search", the panel contains:

Parameters to algorithms are typically selected through drop-down
menus, checkboxes, and vertex selectors. Note that for vertex
selectors, such as the ones labeled "Start Vertex" and "End Vertex" in
the Dijkstra's Algorithm options, a user can type in a vertex number,
use the arrows to increment or decrement the selected vertex number,
or, most usefully, click in the vertex selector, then click on a
vertex on the map.
Once the algorithm and its parameters have been selected, the
"Visualize" button will set up HDX to begin the AV.
Selecting an Algorithm
At this point, the HDX window will update to look something like
this:
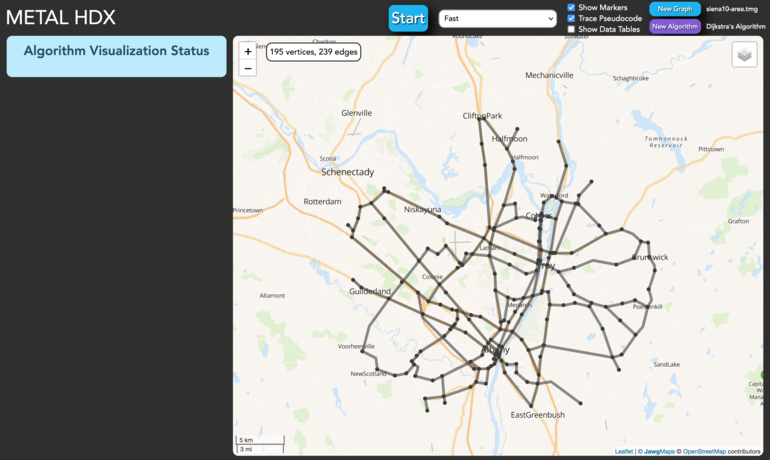
The "Algorithm Visualization Status" panel is created on the left.
and the top control bar is been populated with items to control the
AV, and the data on the map is redrawn in all black. For
vertex-only algorithms, graph edges are not relevant, so are hidden.
Working right to left across the top control bar, the "New Graph"
and "New Algorithm" buttons can be used to go back to previous steps
in the setup process. Graph vertices can be hidden by unchecking
"Show Markers" (probably don't want to do this). The "Trace
Pseudocode" checkbox indicates whether the user wishes to see the
algorithm's pseudocode once the AV starts. The "Show Data Tables"
checkbox brings up a tabular representation of the data in addition
to the one on the map. This is off by default to give more screen
space to the map, but it can be instructive to see the data in
tabular form as well.
The speed selection dropdown is next toward the left.
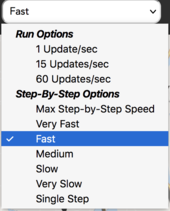
Speed options are broken down into two groups. The "Run Options"
are used to see longer-term trends in the progress of an AV. Not
every step is shown on the screen, but rather many steps are
completed between each screen refresh. "60 Updates/sec" gives a
nice, smooth animation of the AV progressing quickly, while "1
Update/sec" maximizes run speed with fewer screen updates to allow
and AV to run to completion (or the next breakpoint) as quickly as
possible. The "Step-By-Step Options" will update the screen after
every step is completed (i.e., after each line of code executed).
The different speeds here determine how long the AV will wait
between steps. "Max Step-by-step" pauses only 1 ms between steps,
"Fast" pauses 75 ms, and "Very Slow" pauses for 2 seconds. "Single
Step" pauses until the AV is manually restarted. These options can
allow a user to observe how every line of code affects the variables
and data structures as the AV proceeds.
Of course, the "Start" button gets the AV going.
Interactive Algorithm Visualizations
Once the AV has begun, the screen is updated to look something like
this:
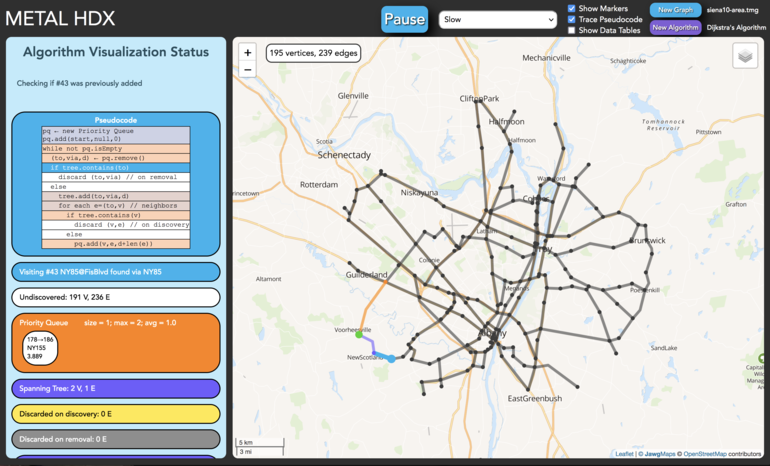
The "Algorithm Visualization Status" panel is updated to show the
pseudocode for the AV (if enabled), and a series of panel entries
that show values of key variables and data structures. The top
panel continues to be functional, allowing the AV to be paused or
the speed to be changed, or the data tables shown or hidden. When
running at speeds slow enough to be able to see them, the top of the
AV Status panel has a description of the currently-executing line of
code. Colors have consistent meanings in the AV Status panel, in
data tables, and on the map. In the Dijkstra's Algorithm AV, orange
indicates the contents of the priority queue. When running in
step-by-step modes and with psueudocode enabled, each line of code
is highlighted as it is executed. The background colors of other
lines of pseudocode are updated based on execution frequency on a
scale from red (executed frequently) to blue (executed rarely).
Hovering the mouse over a line of pseudocode shows its exact
execution count. Hovering over the description of the current line
of code (at the top of the AV Status panel) shows the descriptions
of the 5 most recent lines executed. Hovering over other elements
in the AV Status panel gives further details. For example, hovering
over edge entries in the Dijkstra's Algorithm priority queue gives
more details about that edge.
Breakpoints
METAL's AVs feature the ability to set breakpoints, in some cases
conditionally. To set a breakpoint, click on the line of pseudocode
in the AV Status panel.
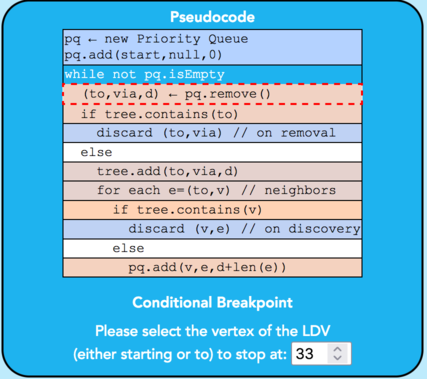
The line will become outlined in a red dashed border. If the line
supports conditional breakpoints, additional information about the
conditional breakpoint (such as the value of a variable at which to
break) will appear at the bottom of the Pseudocode area. As the AV
continues at any execution speed, it will pause when the line is
encountered (subject to any conditions, for conditional breakpoints).
To change the breakpoint to a different line, click on the line for
which to set the new breakpoint. To clear the conditional breakpoint,
click on the previously-selected line. METAL currently supports
only one breakpoint at a time.