 Map-based Educational Tools for Algorithm Learning (METAL)
led by Dr. James D. Teresco
Motivation
|
"An algorithm must be seen to be believed, and the best way to learn what an algorithm is all about is to try it." |
| - Donald E. Knuth, The Art of Computer Programming, Volume 1 (1997), p. 4. |
Nearly any topic in a course working with data will be more
interesting for students if the data has connections to the real world
and if they can visualize the data and results in a meaningful way.
When using graph data, such as in a data structures or algorithms
class, it needs to be small enough to be manageable, but large enough
to be interesting. This might consist of a small road system, airline
flight schedules, or even the layout of a campus or building.
The
Map-based Educational Tools for Algorithm Learning (METAL)
project provides data and visualization capabilities for this purpose.
METAL's graph data sets range in size from a few vertices and edges to
several hundred thousand. Its data is derived from
the
Travel Mapping (TM)
Project, and represents highway systems from around the world.
METAL's
interactive code-level algorithm visualization capabilities with
debugger-like controls are intended to aid student understanding of
graph and other algorithms. Students can also implement graph algorithms
themselves in a programming language of their choice and display, in
map form, the results of computations using those algorithms when
applied to METAL data.
News and Discussion
Project news and discussions can be found in the METAL section of
the
Travel Mapping
Forum.
Graph Data
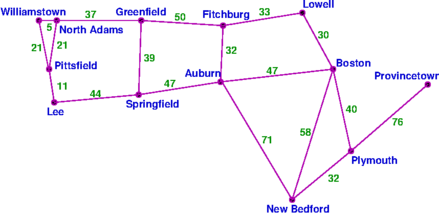
Wouldn't it be more fun, interesting and engaging
to work with this graph
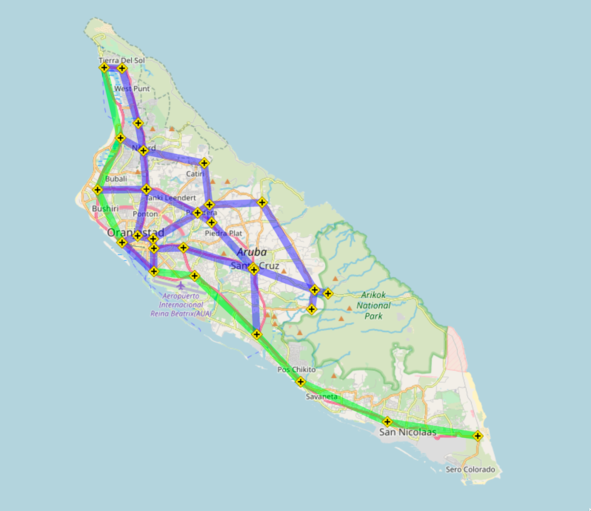
than this one? (which I used for several years)
TM's data is updated daily, and
an
updated collection of
graphs is generated almost as frequently from this data. Stable
archives of graph data are saved periodically. These graphs represent
the highways in various regions, countries, and highway systems, and
are provided in well-defined
formats.
Those interested can read
more about where it
comes from and how it is generated. The highway systems and regions
in
Travel Mapping (TM), from
which METAL derives its data, vary in size, meaning graph data comes
at a variety of scales. They vary in size from just a
handful of vertices and edges for systems in small island nations to
several hundred thousand for the global data set.
The Highway Data Examiner
The
Highway Data Examiner (HDX) is is a browser-based tool which uses
Leaflet to provide map capabilities.
HDX supports plotting of the TM and derived data, and a suite of
interactive algorithm visualizations.
Interactive Algorithm Visualization
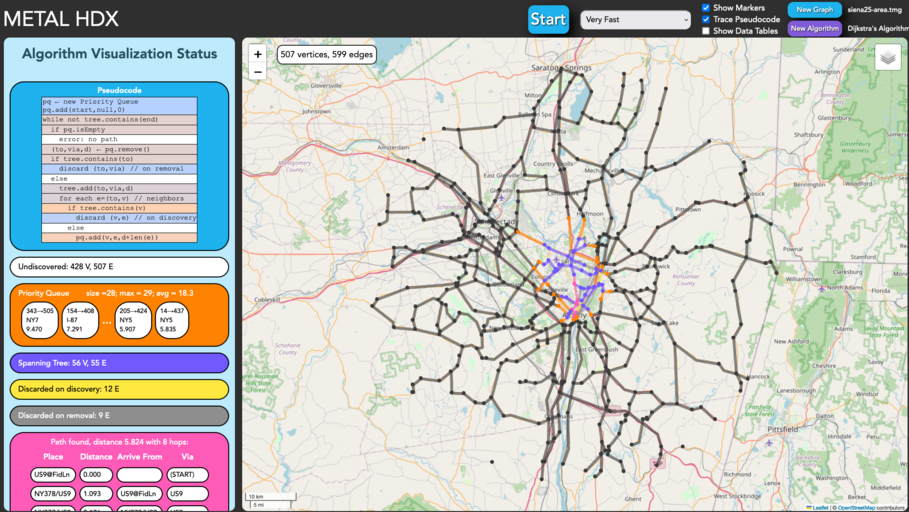
METAL's most engaging feature is its interactive algorithm
visualizations. After loading a graph data file into HDX, an algorithm
can be chosen, along with any needed parameters (e.g., a starting
vertex for a traversal). A set of controls are used to start, pause,
reset, or change the speed of the simulation. During the simulation,
the data plus the contents of key variables and data structures are
displayed in map and, optionally, tabular form. The algorithm's code
can be simulated line-by-line, and conditional breakpoints can be used
to stop the simulation at points of interest. Our expanding set of
algorithms supported include simple vertex- and edge-based searches,
closest pairs, graph traversals, finding connected components, finding
convex hulls, quadtree construction, space-filling curve traversals, a
recursive coordinate bisection partitioner, Dijkstra's algorithm and
the A* algorithm for single-source shortest paths, Prim's algorithm
and Kruskal's algorithm for minimum spanning trees, brute-force and an
approximation of the traveling salesperson algorithm, bridge
detection, and graph coloring.
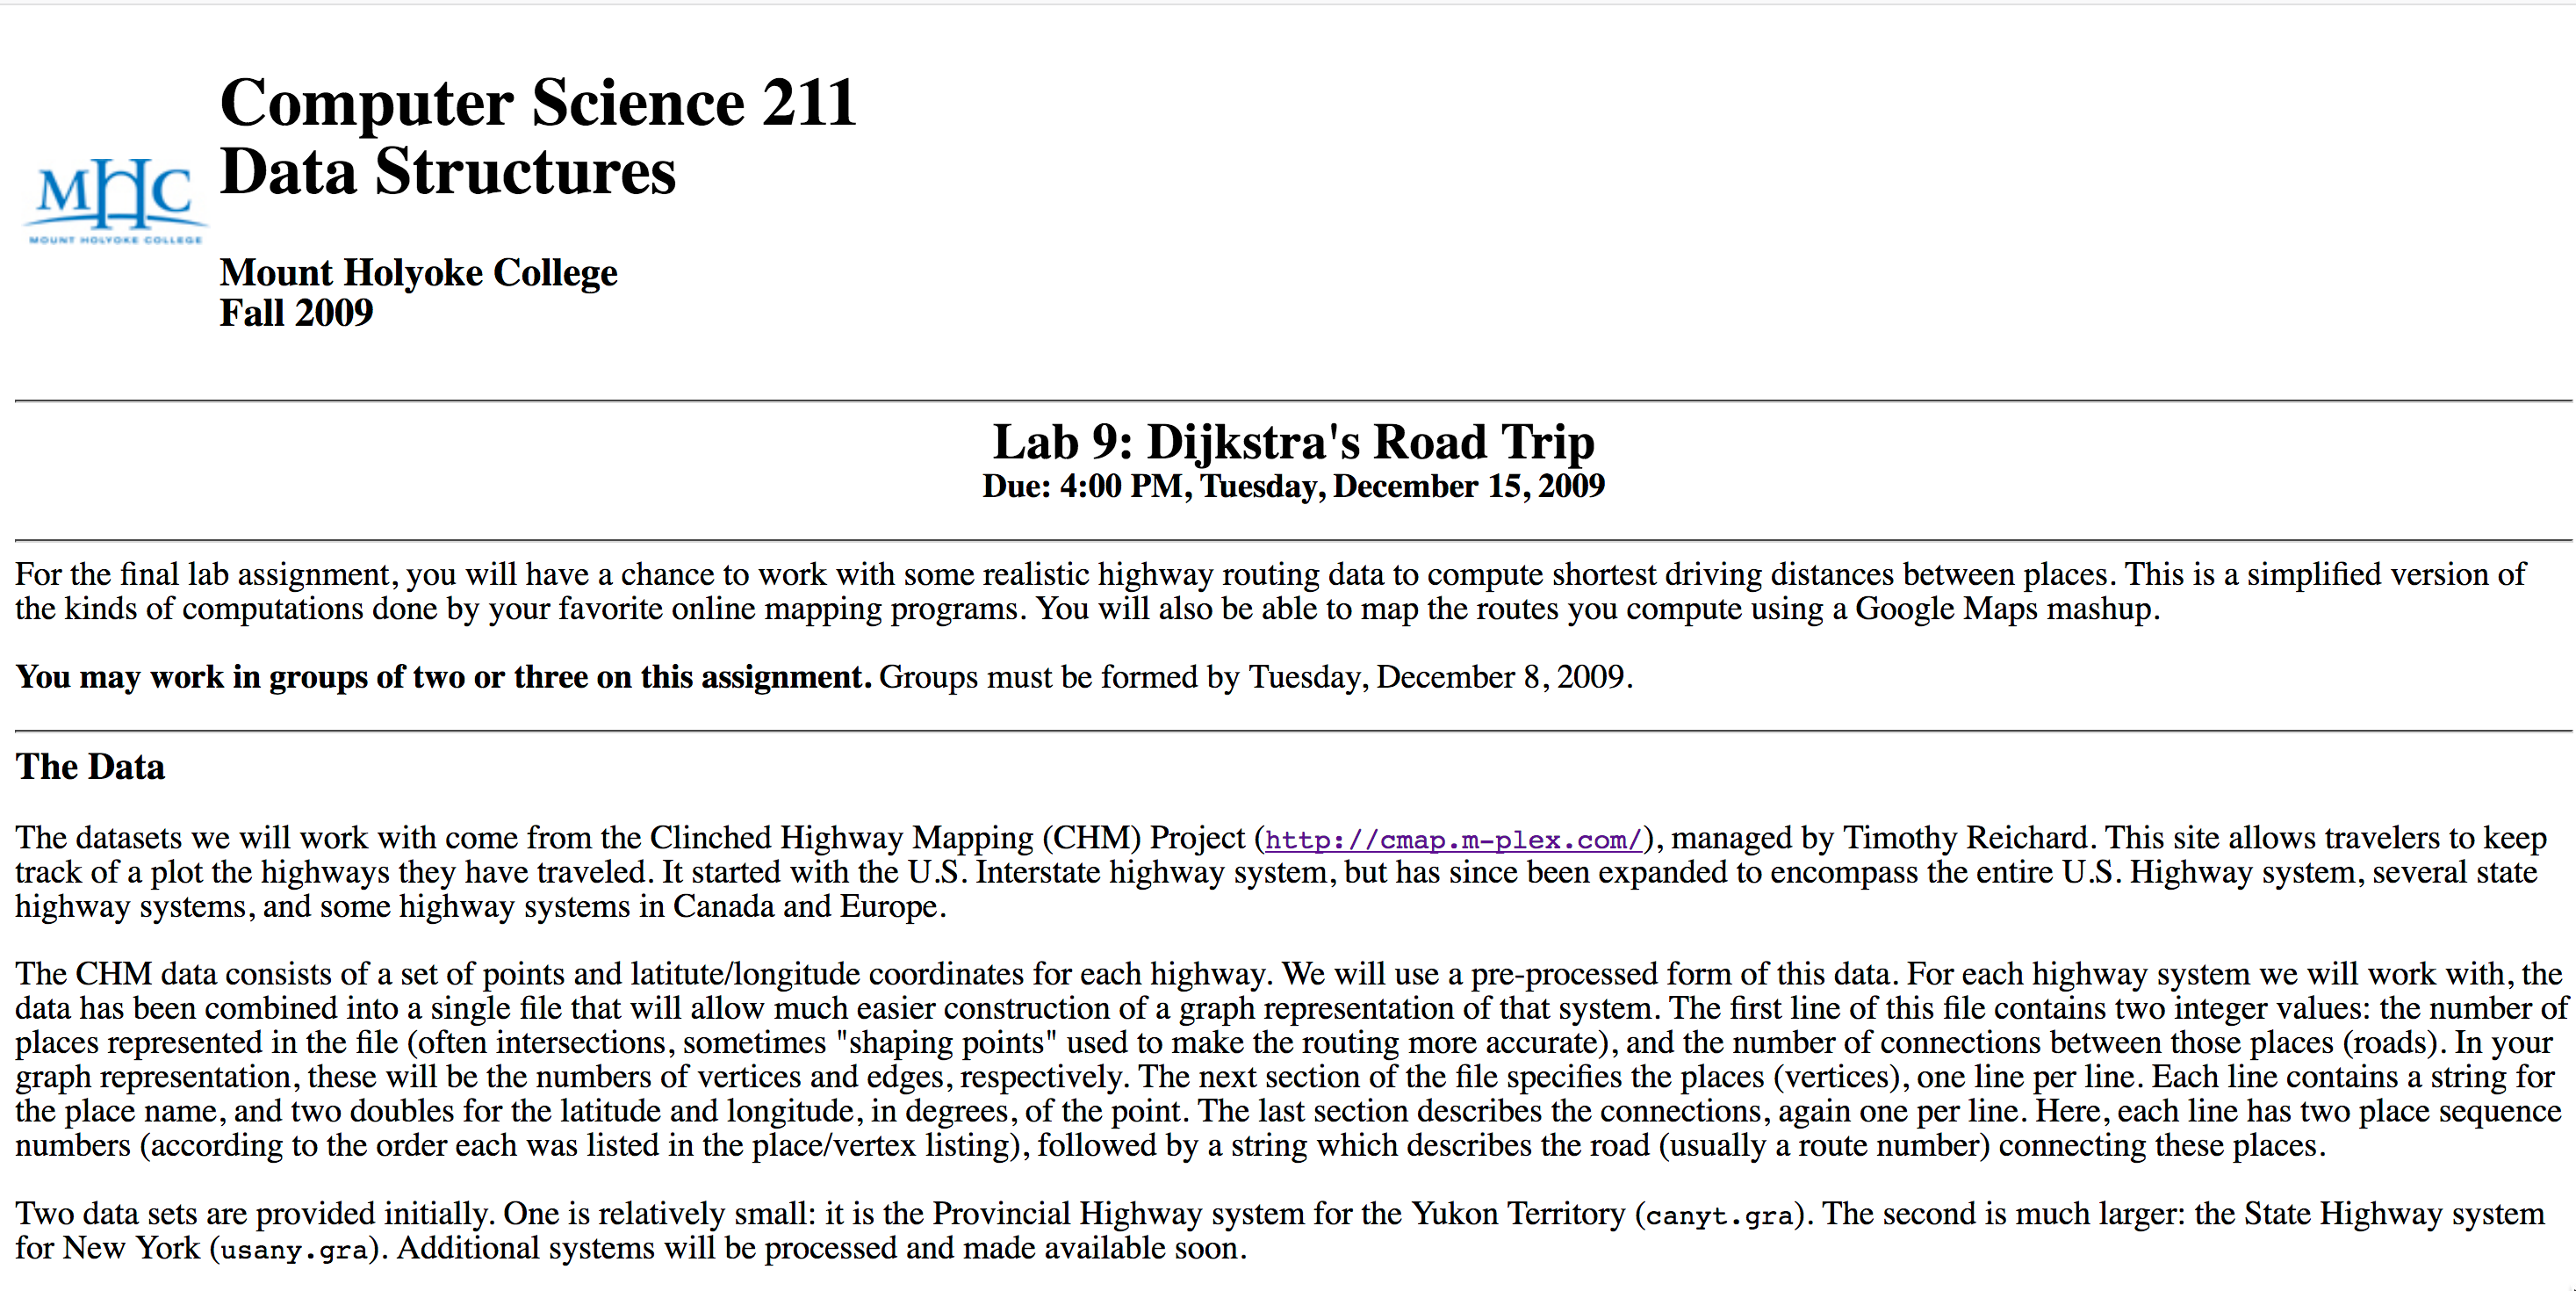
Usage in Class Assignments
METAL's graph data files can be used as input for class examples or
assignments in a data structures, algorithms, or other courses. This
data was first used in
a
laboratory assignment for a data structures course at Mount Holyoke
College where students were required to build a graph structure
representing a highway system then perform Dijkstra's algorithm to
compute the shortest route between two specified waypoints. Student
programs generated output files listing the road segments along the
shortest path. These were then uploaded to a course web server, where
an instructor-provided program (an early predecessor to today's HDX)
used the Google Maps API to visualize their results. Students were
able to develop and debug their programs using small data sets like
the Hawaii Interstates, then use those programs to compute much more
complex routes using the larger data sets. The software has been
updated and extended and used in numerous courses at Siena College and
The College of Saint Rose. Successful assignments include the creation
of custom classes to store the information about the points and
connections between them, storing these points and connection in a
data structure and then searching within and sorting those points (a
great way to motivate comparators), finding convex hulls, performing
graph traversals, and more advanced graph algorithms including
Dijkstra's algorithm.
Recent efforts have included the development of easily-adoptable
learning modules that use METAL data and algorithm visualization
capabilities.